
The Federal Reserve sets a target range for its policy rate. In 2026 that range is 3.50% to 3.75%, held since December 2025, per FRED. “Fed rate cuts 2026” refers to whether and when the Fed lowers it further. The Fed decides only at its scheduled meetings; between them, traders price the odds of a cut using fed funds futures, which CME FedWatch turns into probabilities, and the 2-year Treasury yield. Everything here is reported market pricing, not a prediction.
This content is for information and education only and is not investment advice. Rates and yields are as of the dates shown and change continuously. The Fed’s decisions are made by the FOMC; nothing here forecasts them.
Where rates stand right now
| Measure | Level | As of |
| Fed funds target range | 3.50% – 3.75% | 2026-07-08 (FRED) |
| Held at this range since | December 2025 | FRED step history |
| 2-year Treasury yield | about 4.19% | 2026-07-07 (FRED) |
| 10-year Treasury yield | about 4.55% | 2026-07-07 (FRED) |
Where U.S. rates stand (FRED). A snapshot, not a forecast; refreshed at publication.
Where do interest rates stand in 2026?
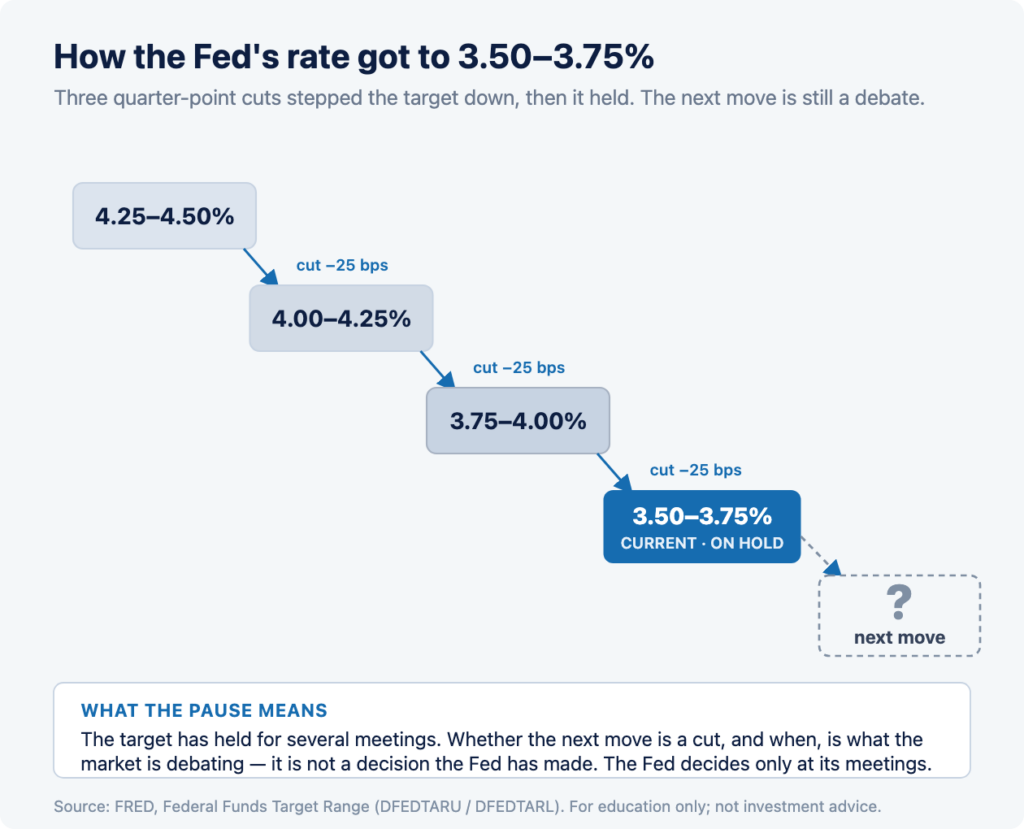
The Fed’s target range is 3.50% to 3.75%, and it has held there since December 2025, according to FRED. That followed three straight quarter-point cuts in the autumn of 2025, after which the Fed paused. So the 2026 question is not whether cuts have started, they have, but whether and when the next one comes.
Three cuts, then a pause
The autumn-2025 sequence stepped the target down in three moves, from 4.25%-4.50% to the current 3.50%-3.75%. Since then the Fed has held at every meeting through the first half of 2026. A pause this long is itself information: it tells you the Fed is waiting for the data to decide the next step, which is exactly why each data release and each set of minutes now gets so much attention.
The rate is a range, not a single number
The Fed targets a range, currently 3.50% to 3.75%, rather than one figure. A “cut” almost always means lowering that range by 0.25 percentage points, or 25 basis points. Knowing the target is a range helps you read the headlines correctly: the debate is about the next 25-basis-point step, not a large one-off move.
What are the Fed minutes, and why do they move markets?
The Fed minutes are the detailed record of an FOMC meeting, released three weeks after the decision. They move markets because they reveal how divided or united officials were and what would change their minds, which helps traders reprice the odds of the next cut.
Minutes come after the decision
Each rate decision is announced on the meeting day, but the minutes, the fuller account of the discussion, are published about three weeks later at 2:00 p.m. ET. For example, the minutes released on July 8, 2026 were the record of the June 16-17 meeting. So minutes day is not a decision day; it is a day the market re-reads the last decision for clues.
Why a backward-looking document still moves prices
Even though the minutes describe a past meeting, they can shift what is priced for future meetings. If the discussion reads more cautious about cutting than expected, traders may push cut expectations further out; if it reads more open to cutting, they may pull expectations forward. The document is old news; its effect on the odds is not.
What the minutes actually contain
The minutes summarise the staff’s economic review, the range of views among participants, and the reasoning behind the vote. They do not contain new decisions, and the economic projections, including the well-known “dot plot,” come out at the meeting itself at projection meetings, not in the minutes. What traders mine the minutes for is the balance of opinion: how many officials leaned toward cutting, and what data they said they were waiting to see.
A dated case study: the week the narrative whipsawed
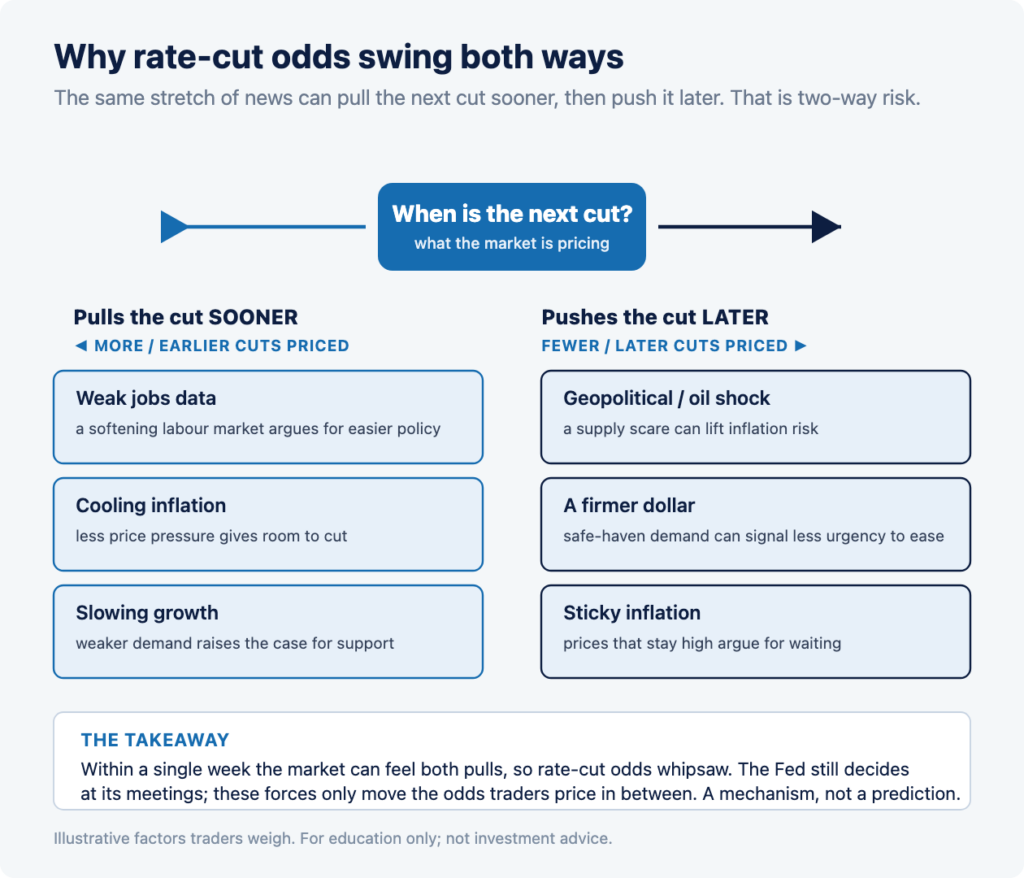
In early July 2026, rate-cut expectations swung both ways within a single week, which makes it a clean, dated case study of how quickly the story can flip. The details below are attributed reporting and sourced yields, not current levels.
First, weak jobs data pulled cuts forward
In early July 2026, a soft jobs print led traders to price a nearer-term cut, and, as reported by Reuters, the dollar fell and bets on a September cut were pulled forward. The 2-year Treasury yield, the cleanest market read of cut expectations, ticked down from 4.17% on July 1 to 4.14% on July 2 (FRED), consistent with more easing being priced.
Then a geopolitical shock pushed the other way
Within days the story flipped. A flare-up around Iran and the Strait of Hormuz sent traders toward safe havens, and, per Reuters, the dollar climbed back toward a week-high and gold pushed toward records. The 2-year yield recovered to 4.19% by July 7 (FRED). Same week, opposite pressure. Nothing about the Fed’s target had changed; only the odds the market was pricing had.
| Date | 2-year yield | What moved it (attributed) |
| July 1 | 4.17% | pre-data baseline |
| July 2 | 4.14% | weak jobs print, more cuts priced, softer dollar (Reuters/BLS) |
| July 6 | 4.13% | holiday-thinned trade |
| July 7 | 4.19% | Iran shock, safe-haven demand, dollar toward a week-high (Reuters) |
The 2-year Treasury yield across the whipsaw week (daily, FRED). The move is small but two-directional; that is the point.
How does the market price a rate cut?
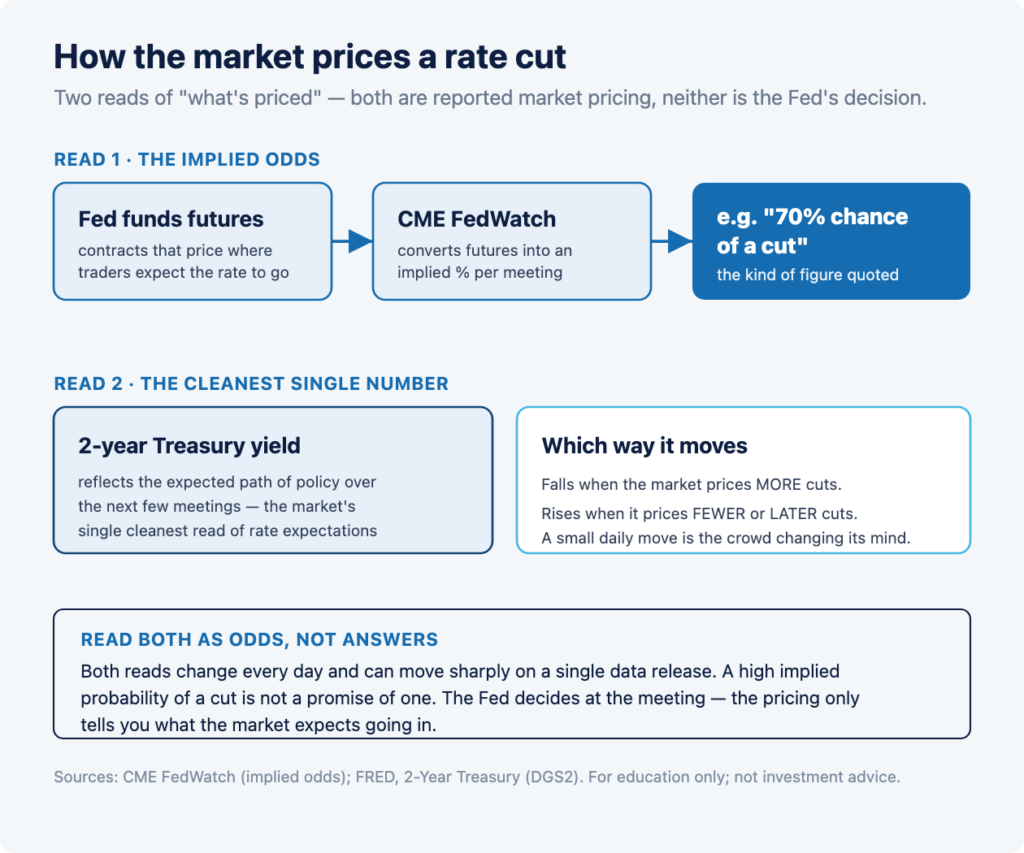
The market prices a rate cut in three linked ways: fed funds futures, the probabilities CME FedWatch derives from them, and the 2-year Treasury yield. None of these is a forecast from the Fed; they are what traders are collectively willing to bet, and they change every day.
Futures and the FedWatch odds
Fed funds futures are contracts whose price reflects where traders expect the policy rate to be. CME FedWatch translates those prices into an implied probability of a cut at each upcoming meeting, which is the kind of “70% chance of a cut” figure you see quoted in the press. It is useful precisely because it is transparent and updates live, but it is a market opinion, not the Fed’s plan, and it can move sharply on a single data release.
The 2-year yield: the cleanest single read
The 2-year Treasury yield is widely watched as the cleanest single read of rate expectations, because a 2-year horizon captures the path of policy over the next several meetings. When the market prices more cuts, the 2-year tends to fall; when it prices fewer or later cuts, it tends to rise. That is why the small move from 4.14% to 4.19% in the case study above matters: it is the market changing its mind in real time.
Read pricing as odds, not answers
The key discipline is to treat all of this as odds that change, not as answers. A high implied probability of a cut is not a promise of one, and the Fed has held before when the market leaned toward a move. The Fed decides at the meeting; the pricing only tells you what the crowd expects going in.
Why do rate expectations move the whole market?
Rate expectations move the whole market because interest rates are the benchmark against which nearly every asset is priced. When the expected path of rates changes, the present value of future cash flows changes with it, which is why a shift in cut odds can move stocks, bonds, and the dollar at the same time, not just rate products.
Rates are the price of money
A higher expected rate raises the return available on cash and safe bonds, which, all else equal, tends to pressure the valuations of riskier and longer-dated assets; a lower expected rate does the reverse. This is a valuation mechanism, not a rule about any single stock, and “all else equal” almost never holds in practice. It explains why a Fed headline can move a market that has nothing directly to do with interest rates.
Why cuts are not simply “good for stocks”
It is tempting to read a rate cut as automatically positive for equities, but the relationship is not mechanical. Sometimes the market falls on a cut, because the cut signals the economy is weakening faster than hoped; sometimes it rises on a hold, because the data looked strong. That is why this article treats rate expectations as context for volatility, not as a directional signal. Nothing here says a cut is good or bad for any market, or predicts how any market will react.
The 2026 meeting calendar
The Fed changes rates only at scheduled FOMC meetings, so the calendar is the backbone of the rate-cut debate. The remaining 2026 meetings are the only dates on which the target can actually move.
| Meeting | Dates | Notes |
| July | July 28–29 | rate decision |
| September | September 15–16 | rate decision, plus economic projections and a press conference, the “September” focus of the debate |
| October | October 27–28 | rate decision |
| December | December 8–9 | rate decision, plus economic projections and a press conference |
Remaining 2026 FOMC meetings (federalreserve.gov). The Fed decides on these dates; the market prices odds in between.
Why September gets the attention
September is a meeting that comes with fresh economic projections and a press conference, which makes it a natural focal point for a policy change and for scrutiny. That is a large part of why the market’s cut debate has centered on September rather than July. It does not mean a cut will happen then; it means that is where attention and pricing have concentrated.
How rate-cut cycles have traded historically
Historically, the market tends to move ahead of the Fed, and rate cuts arrive in steps punctuated by long pauses rather than in a straight line. The recent cycle is a live example: three cuts, then a hold of more than half a year.
The market leads the Fed
The 2-year yield often moves well before the Fed acts, because it prices expectations rather than decisions. In the current cycle, yields moved as the data shifted while the target itself sat still, which is the normal relationship: the policy rate is the slow-moving anchor, and market yields do the day-to-day repricing around it.
Cuts come in steps, with pauses
The autumn-2025 sequence, three quarter-point cuts followed by a multi-month hold, is a reminder that a “cutting cycle” is not a continuous glide path. Pauses are part of it, and a pause can last for several meetings. Reading the cycle as “cuts have started, so more must be coming soon” is exactly the assumption the data can overturn, as the two-way case study showed.
What traders watch on minutes day
On minutes day, active traders watch the 2:00 p.m. ET release, the immediate move in the 2-year yield and the dollar, and how the FedWatch odds shift. These are factual watch-items that describe the reaction, not signals to trade, and each can move within seconds of the release.
- The 2:00 p.m. ET release: minutes drop at a fixed time, and the first reaction is often the sharpest, in seconds to minutes, before the market settles into a considered read.
- The 2-year yield and the dollar: the cleanest immediate reads on whether the minutes were taken as leaning toward or away from cuts, because both reprice fast.
- The FedWatch odds: whether the implied probability of a cut at the next meeting moves, and by how much, which quantifies how the market re-read the meeting.
- The tone words: whether the discussion reads more cautious or more open on cutting than the market expected, since the surprise, not the level, is what moves prices.
- The equity and volatility reaction: whether stocks and a gauge like the VIX move too, which shows how far beyond rate products the market is taking the message.
None of these tells a trader what the Fed will do. They describe how the market re-priced the odds, and that re-pricing can reverse by the next session.
What are the risks?
The biggest risk around rate events is the whipsaw: cut expectations can swing both ways within days, as the case study showed, and the 2:00 p.m. minutes release lands in a thinner afternoon session where moves can be exaggerated. Leverage magnifies both directions, which is what makes trading a Fed headline on the first print so dangerous.
- Two-way risk: the same week can price more cuts and then fewer, so a position built on one narrative can be wrong within days.
- Pricing is not a decision: a high implied probability of a cut is not a guarantee; the Fed has held against market leaning before.
- Thin post-2 p.m. liquidity: the minutes release hits mid-afternoon, when spreads can widen and quoted moves can overstate the real one.
- Leverage: trading rate-sensitive names on margin amplifies both gains and losses, and you can lose more than you deposit.
Trading around Fed events involves substantial risk, and most day traders lose money. Nothing here is a recommendation to trade any security, and this article does not predict the Fed’s decision, the level of rates, or any market.
Frequently asked questions
What is the Fed funds rate in 2026?
The Fed’s target range is 3.50% to 3.75%, held since December 2025, according to FRED. A rate cut would typically mean lowering that range by 0.25 percentage points at a scheduled FOMC meeting.
Will the Fed cut rates in September 2026?
No one can say, and this article does not predict it. The Fed decides at its September 15-16 meeting. Between now and then, traders price the odds using fed funds futures, CME FedWatch, and the 2-year Treasury yield, and that pricing changes daily.
What are the Fed minutes?
The minutes are the detailed record of an FOMC meeting, released about three weeks after the decision at 2:00 p.m. ET. The July 8, 2026 minutes were the record of the June 16-17 meeting. They can move markets by shifting the odds priced for future meetings.
Why does the 2-year Treasury yield matter for rate cuts?
The 2-year yield is widely watched as the cleanest single read of rate expectations, because it reflects the expected path of policy over the next few meetings. It tends to fall when the market prices more cuts and rise when it prices fewer.
What is CME FedWatch?
CME FedWatch translates fed funds futures prices into an implied probability of a rate change at each upcoming meeting. It is a transparent, live read of what the market expects, but it is a market opinion, not the Fed’s plan.
When are the remaining 2026 Fed meetings?
Per the Fed’s calendar, the remaining 2026 FOMC meetings are July 28-29, September 15-16, October 27-28, and December 8-9. The September and December meetings also include economic projections and a press conference.
Do rate cuts always help the stock market?
No, not mechanically. A cut can support valuations, all else equal, but markets sometimes fall on a cut when it signals the economy is weakening. Rate expectations are one input among many, and this article does not predict how any market will react.
What is a basis point?
A basis point is one hundredth of a percentage point. A 25-basis-point cut lowers the target range by 0.25 percentage points, and the Fed usually moves in 25-basis-point steps rather than large one-off changes.
References
[1] Federal Reserve Bank of St. Louis (FRED), Federal Funds Target Range, Upper and Lower Limit (DFEDTARU, DFEDTARL): target 3.50%-3.75%, held since December 2025. https://fred.stlouisfed.org/series/DFEDTARU
[2] Federal Reserve Bank of St. Louis (FRED), 2-Year Treasury Constant Maturity Rate (DGS2), daily, values as dated. https://fred.stlouisfed.org/series/DGS2
[3] Federal Reserve Bank of St. Louis (FRED), 10-Year Treasury Constant Maturity Rate (DGS10). https://fred.stlouisfed.org/series/DGS10
[4] Board of Governors of the Federal Reserve System, FOMC Meeting Calendars and Minutes (June 16-17 minutes released July 8, 2026; 2026 meeting dates). https://www.federalreserve.gov/monetarypolicy/fomccalendars.htm
[5] CME Group, CME FedWatch Tool (fed funds futures-implied probabilities of rate changes). https://www.cmegroup.com/markets/interest-rates/cme-fedwatch-tool.html
[6] Reuters, reporting on the early-July 2026 jobs data, the dollar, safe-haven demand, and rate-cut expectations (attributed, dated). https://www.reuters.com
Disclosures: Trading involves substantial risk and is not suitable for every investor. Capital is at risk and most day traders lose money. Leverage amplifies both gains and losses, and you can lose more than you deposit. Client accounts are not SIPC or FSCS insured. This content is provided for information and education only. It is not investment advice or a recommendation of any security, and it does not predict the Federal Reserve’s decisions, the level of interest rates, or any market. Rate-cut probabilities described here are market pricing reported by third parties such as CME FedWatch, not forecasts by us. Rate and yield figures are from FRED, the meeting calendar is from the Federal Reserve, and market-reaction details are attributed to Reuters, as dated above. See our full disclosures and policies.