
An oil supply shock is a sudden threat to the flow of crude, usually from conflict, an attack on oil infrastructure, or sanctions, that pushes prices up quickly. It matters to traders because roughly a fifth of the world’s oil, about 20 million barrels a day, passes through the Strait of Hormuz alone, per the U.S. Energy Information Administration. A price move then transmits unevenly to energy stocks, helping some and hurting others. This explains the mechanics; it does not predict oil or any stock.
This content is for information and education only and is not investment advice. Prices are as of the dates shown; oil markets move continuously.
Where crude is trading now
| Benchmark | Recent price | As of |
| WTI crude | about $69.60 per barrel | 2026-07-06 (FRED) |
| Brent crude | about $69.56 per barrel | 2026-07-06 (FRED) |
Recent crude benchmarks (daily, FRED). A snapshot, not a forecast; refreshed at publication.
What is an oil supply shock?
An oil supply shock is a sudden disruption, or threat of disruption, to the amount of crude reaching the market. It usually comes from geopolitics: a conflict near a major producer, an attack on oil infrastructure, or new sanctions. Because oil is priced globally and traded around the clock, the market reprices the risk within minutes.
Supply shocks vs demand shocks
Not every oil move is a supply shock. Prices also move on demand, which is why oil fell to record lows during the 2020 demand collapse. A supply shock is specifically about the flow of barrels being threatened, and it tends to push prices up fast, whereas a demand shock pushes them down. Knowing which one is driving a move is the first step to understanding it.
Why traders watch it
For an active trader, an oil shock is one of the few events that can move dozens of stocks at once, across energy, transport, and the broad market. The move often arrives overnight, as a gap, which is how a geopolitical headline reaches a trading screen before the opening bell.
Why the Strait of Hormuz matters
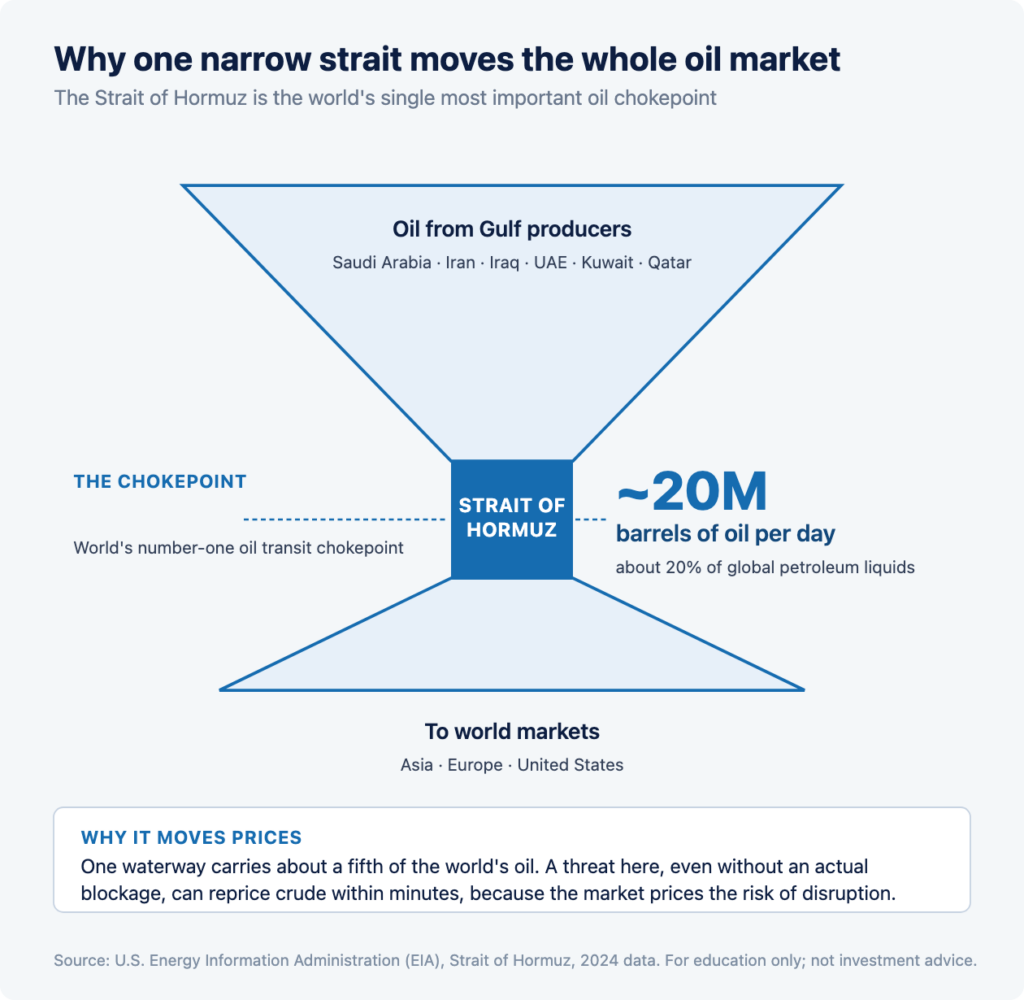
The Strait of Hormuz matters because it is the single most important chokepoint for the world’s oil. According to the EIA, about 20 million barrels of oil per day passed through the strait in 2024, equal to roughly 20% of global petroleum liquids, so any threat to it can move the entire oil market.
A chokepoint is a concentration of risk
A chokepoint is a narrow passage that a large share of supply must pass through, so a small physical space carries an outsized share of the world’s oil. When one waterway carries a fifth of global crude, a threat there, even without an actual blockage, is enough to move prices, because the market prices the risk of disruption, not just disruption itself.
The threat is often enough
Prices frequently rise on the fear of a disruption rather than an actual one. Tanker traffic slowing, vessels rerouting, or an attack nearby can lift crude even if not a single barrel is ultimately stopped. That is why an oil shock can spike and then fade quickly if the threat passes, a pattern covered in the risks section.
The transmission chain: from headline to your screen
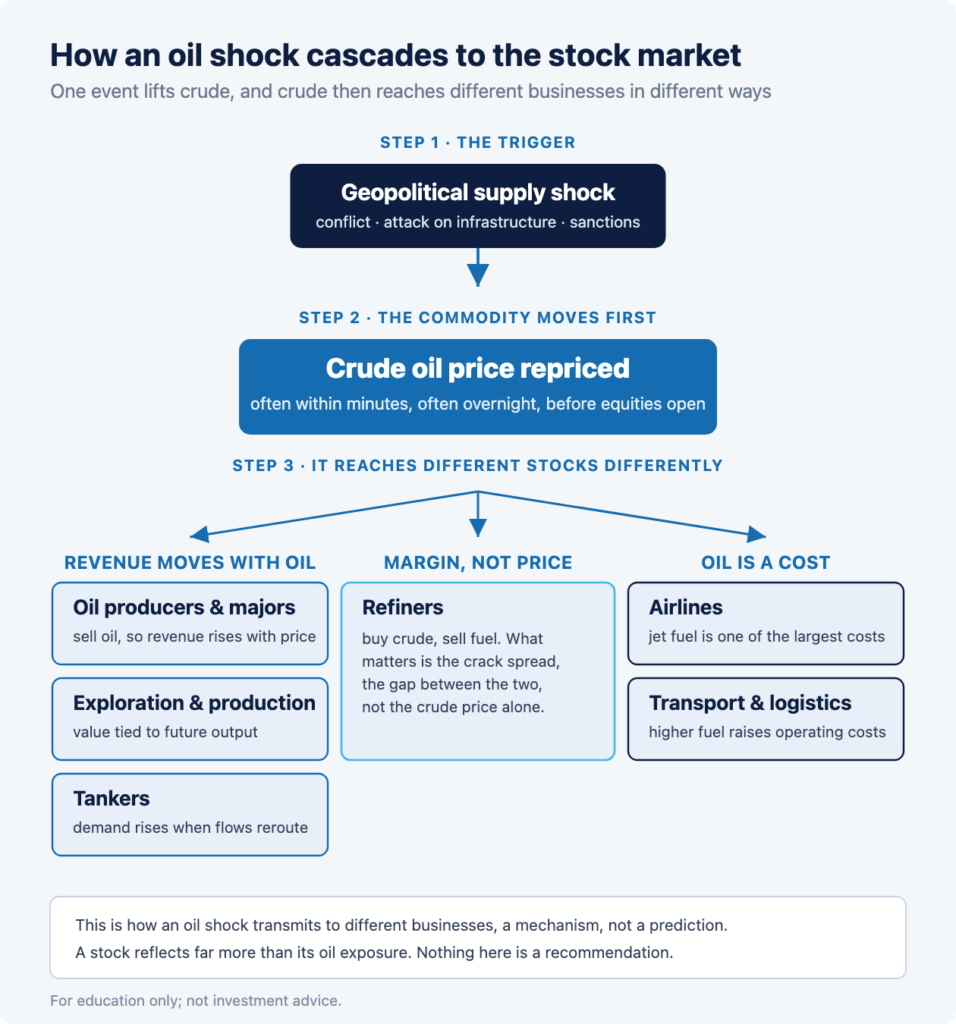
An oil shock reaches energy stocks through a chain: a geopolitical headline lifts the price of crude, and the change in crude then flows through to the companies that produce, refine, ship, and consume it. Each link reacts differently, which is why one headline can move many stocks in different directions.
Headline to crude
The first move is in the commodity itself. Crude futures trade nearly around the clock, so they reprice on the news, often within minutes and often overnight, before equity markets open. The size of that first move reflects two things: how much supply is genuinely at risk, and how the market judges the odds that the threat becomes a real disruption. A headline that threatens a large, hard-to-replace share of supply moves crude more than one that threatens a small volume other producers can cover. That is why two conflicts of similar headline drama can produce very different price reactions.
Crude to equities
The change in crude then reaches the stocks, but it does not reach them evenly. A company whose revenue rises with the oil price reacts differently from one whose costs rise with it, and a third group, the refiners, cares about neither the level alone but the gap between crude and the fuel they sell. Because the reaction depends on where a business sits in the oil chain, a single crude move can push some stocks up and others down in the same session. That uneven transmission is the subject of the next two sections, and it is why an oil shock is not simply good or bad for the market as a whole.
The same shock helps some stocks and hurts others
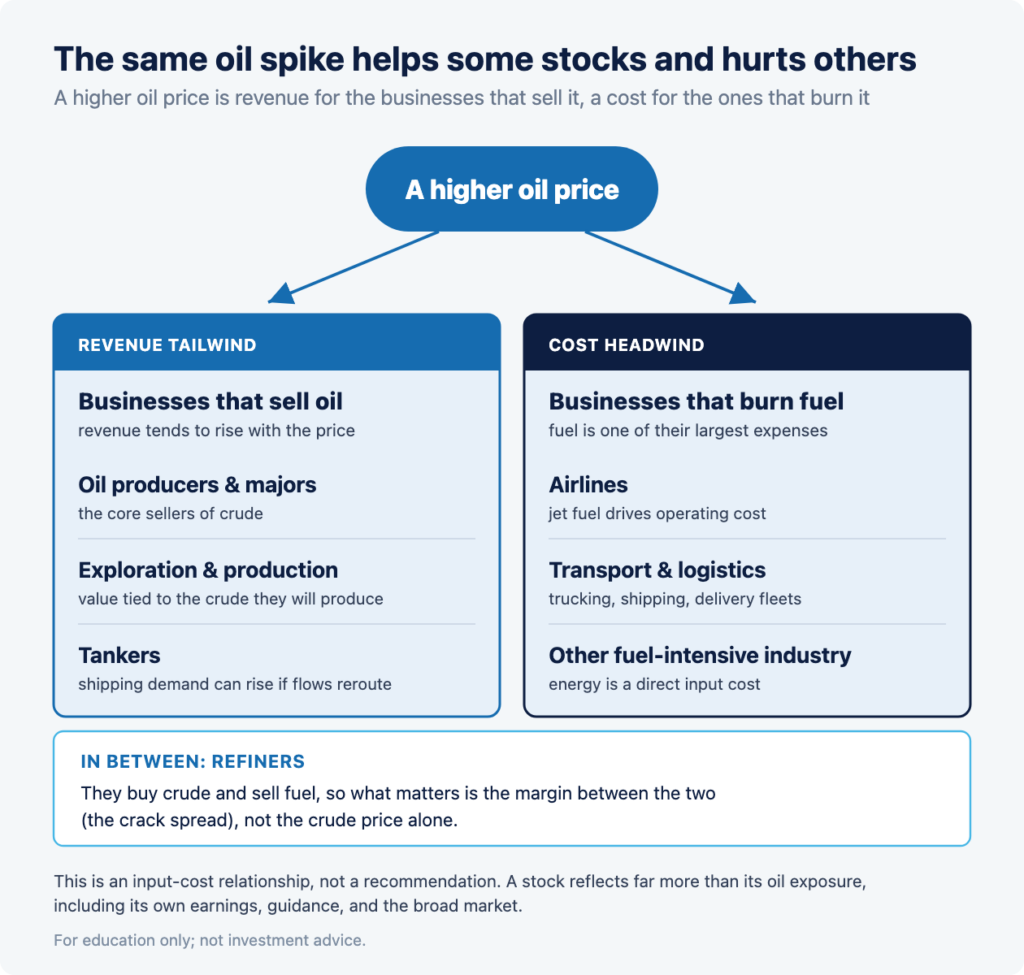
The same rise in oil is a revenue tailwind for the companies that sell oil and a cost headwind for the companies that burn it. That is why an oil spike lifts some energy names while pressuring airlines and other fuel-intensive businesses on the same day.
The revenue-side groups
Oil producers, exploration and production (E&P) companies, and, when disruptions raise shipping demand, tankers, tend to see higher oil as a revenue positive, because they sell oil or the service of moving it. As one example, during a recent price rise, ExxonMobil signaled that higher oil prices would boost its quarterly profit, as reported.
The cost-side groups
Airlines and other transport-heavy businesses tend to see higher oil as a cost negative, because fuel is one of their largest expenses. Refiners sit in between: they buy crude and sell products, so what matters to them is the margin between the two, known as the crack spread, rather than the crude price alone.
The important caveat
This is an input-cost relationship, not a trading signal. A stock’s price reflects far more than its oil exposure, including its own earnings, guidance, and the broad market. The groups above describe how oil flows through a business, not which stock to trade. Nothing here is a recommendation.
A recent case study: the Strait of Hormuz, early July 2026
In early July 2026, a flare-up around Iran and the Strait of Hormuz produced a textbook supply-scare pattern, which makes it a useful, dated case study of the mechanics above. The details below are attributed reporting from the time, not current prices.
What happened
In early July 2026, as reported by Reuters, US and Iran traded strikes, several oil and gas tankers turned back from the Strait of Hormuz after vessel attacks, and the US reinstated sanctions on Iranian oil sales. Crude rose over 3% on the news, per Reuters, and equity markets reflected the shift: Reuters reported gold gaining on safe-haven demand, the dollar near a week-high, and, in a later session, London’s FTSE 100 ticking higher as Shell lifted energy stocks. As context, WTI and Brent were trading around $70 a barrel in early July 2026 (FRED).
The mechanics on display
The episode ran the chain end to end: a geopolitical headline (strikes and tanker attacks) → a crude move (over 3%, Reuters) → uneven equity reactions (energy names lifted, ExxonMobil signaling a profit boost from higher prices, while safe-haven assets like gold rose). It is the transmission diagram above, playing out in real time. It is shown here to illustrate the pattern, not to suggest how any future event will resolve.
How oil shocks have traded historically
History shows oil shocks can be sharp and fast, but they resolve in very different ways, and oil is not a one-way bet. The table below shows three real episodes, using daily WTI prices from FRED.
| Episode | Type | WTI move | What it shows |
| Abqaiq attack on Saudi oil facilities (Sep 2019) | Supply (infrastructure attack) | about $54.76 to $63.10, roughly +15% in one day | An attack on oil infrastructure can spike prices instantly, then fade |
| Russia invades Ukraine (Feb to Mar 2022) | Supply (conflict + sanctions) | about $92 to $124, roughly +34% over two weeks | A major-producer conflict can drive a large, sustained shock |
| COVID demand collapse (Apr 2020) | Demand (the counterexample) | WTI fell below zero, to about minus $37 | Oil is not a one-way bet; a demand shock can crash it just as fast |
How past oil shocks traded (daily WTI crude, FRED). History, not a forecast.
The pattern and the exception
The two supply episodes show the classic shock shape: a fast spike on the threat, with the 2019 attack fading within weeks and the 2022 conflict sustaining a larger move. The 2020 demand collapse is the essential counterexample: the same commodity that spikes on a supply scare fell below zero on a demand shock. A trader who treats every oil move as a one-way bet is ignoring that history.
Why some shocks fade and others last
Some oil shocks fade within days while others last for months, and the difference usually comes down to whether the missing barrels can be replaced. When other producers can raise output, or the threat passes without an actual disruption, prices tend to unwind. When a major source of supply is genuinely removed for an extended period, the higher price tends to persist.
Spare capacity is the shock absorber
When producers can raise output to offset a disruption, the market has a shock absorber, and a spike driven by fear can reverse quickly once traders expect that spare capacity to fill the gap. This is part of why the 2019 Abqaiq spike faded within weeks: the damaged facilities were repaired and the lost barrels were offset. It is also why the response of OPEC and its partners is one of the first things the market weighs during a disruption.
A lasting loss sustains the move
When barrels are removed for a prolonged period, as with an extended conflict or broad sanctions on a major producer, there may be no quick replacement, and the higher price tends to hold. That is closer to the 2022 pattern. The same size of headline can therefore produce very different follow-through, which is why the durable question is not “how dramatic is the news” but “can the lost supply be replaced, and how fast.”
How an oil shock reaches your screen: premarket and gaps
Because geopolitical events happen at any hour, an oil shock usually reaches traders as an overnight gap: energy stocks open far from their prior close, in thin premarket conditions. The mechanics of that gap are the same as any premarket mover.
The overnight gap
A shock that hits overnight reprices crude futures first, and energy stocks then gap at the open to reflect it. In the thin premarket session, spreads are wider and quoted moves can be exaggerated, and the gap can extend or reverse when full-session liquidity arrives at 9:30 a.m. ET. Our guide to premarket movers covers how gaps form and why they are risky.
Why the open matters
The opening minutes after a geopolitical gap are typically the most volatile of the day, as the market reprices the overnight move with real volume. That is also where the risk concentrates, which is why position sizing and risk controls matter more than usual on a shock morning.
What traders watch during an oil shock
During an oil shock, active traders generally watch the crude benchmarks, the flow of tankers and shipping data, sanctions and diplomatic headlines, and any OPEC response. These are factual watch-items that describe the situation, not signals to trade.
- The crude benchmarks: WTI and Brent reprice first and set the tone, so a divergence between them can hint at whether the market sees the risk as global or regional.
- Tanker and shipping data: whether vessels are actually rerouting, slowing, or turning back is the difference between a feared disruption and a real one, and the market treats those very differently.
- Sanctions and diplomacy: enforcement, negotiations, and any sign of de-escalation, because a shock priced on fear can unwind the moment the threat looks like it is passing.
- OPEC and producer responses: whether other producers raise output to offset a disruption, as when Saudi Arabia adjusted its crude pricing during the recent episode (Reuters). This is the spare-capacity question that often decides whether a spike holds or fades.
- The VIX and safe-haven moves: whether broad-market volatility and assets like gold are reacting too, which signals how far beyond oil the market is pricing the risk.
None of these tells a trader what oil will do next. They describe the situation, not the outcome, and each one can shift within a single session.
What are the risks?
The biggest risk in trading an oil shock is the whipsaw: the same headline-driven spike can reverse just as fast if the threat passes, and leverage magnifies both directions. Oil is one of the most headline-sensitive markets there is, which is exactly what makes it dangerous to trade on the headline alone.
- Whipsaw on de-escalation: a shock priced on fear can unwind in hours if tankers resume and diplomacy calms the situation, so a position entered at the peak of the fear can be underwater by the next session.
- Not a one-way bet: as 2020 showed, oil can crash as violently as it spikes, and a trader positioned for “conflict means oil up” can be wrong on both the direction and the timing.
- Thin premarket liquidity: shock-driven gaps happen in wide-spread conditions where fills are unpredictable and a quoted price is not the price you may get.
- Leverage: trading energy names on margin amplifies both gains and losses, and you can lose more than you deposit.
- Headline reliability: early reports during a fast-moving geopolitical event are often revised, so a move built on an unconfirmed headline can reverse when the facts change.
Trading around oil shocks involves substantial risk, and most day traders lose money. Nothing here is a recommendation to trade oil, energy stocks, or any security, and this article does not predict the oil price or any stock.
Frequently asked questions
Why do oil prices spike on geopolitical news?
Because the market prices the risk of a supply disruption, not just an actual one. When conflict threatens a major producer or a key waterway like the Strait of Hormuz, traders reprice crude quickly, often before any barrels are actually stopped.
Why is the Strait of Hormuz so important?
About 20 million barrels of oil a day, roughly 20% of global petroleum liquids, pass through it, per the EIA. That makes it the world’s most important oil chokepoint, so any threat there can move the entire oil market.
Which stocks go up when oil rises?
Companies whose revenue is tied to oil, such as producers and E&P names, tend to benefit from higher prices, while fuel-intensive businesses like airlines face higher costs. This is an input-cost relationship, not a recommendation, and a stock reflects far more than its oil exposure.
Do oil shocks always push prices up?
No. Supply shocks push prices up, but demand shocks push them down. In April 2020, a demand collapse sent WTI below zero. Oil is not a one-way bet.
How does an oil shock reach the stock market?
Usually as an overnight gap. Crude futures reprice on the news, and energy stocks gap at the next open to reflect it, often in thin, volatile premarket conditions.
Do oil price spikes last?
It depends on the cause. The 2019 Abqaiq attack faded within weeks, while the 2022 Russia-Ukraine shock sustained a larger move. A spike driven purely by fear can reverse quickly if the threat passes.
Why do some oil shocks fade and others last?
Usually because of whether the missing barrels can be replaced. When other producers hold spare capacity, or the threat passes without a real disruption, prices tend to unwind. When supply is genuinely removed for a long time, the higher price tends to hold.
What is the crack spread?
It is the gap between the price of crude oil a refiner buys and the fuel it sells. Refiners care about that margin more than the crude price alone, which is why they can react differently from producers to the same move in oil.
References
[1] U.S. Energy Information Administration, “Amid regional conflict, the Strait of Hormuz remains critical oil chokepoint”: about 20 million barrels per day, roughly 20% of global petroleum liquids, transited the strait in 2024. https://www.eia.gov/todayinenergy/detail.php?id=65504
[2] U.S. Energy Information Administration, World Oil Transit Chokepoints. https://www.eia.gov/international/analysis/special-topics/world_oil_transit_Chokepoints
[3] Federal Reserve Bank of St. Louis (FRED), Crude Oil Prices: West Texas Intermediate (DCOILWTICO) and Brent (DCOILBRENTEU), daily, values as dated. https://fred.stlouisfed.org/series/DCOILWTICO
[4] Reuters, reporting on US-Iran strikes, Strait of Hormuz tanker attacks, reinstated sanctions, crude prices, and market reaction, early July 2026. https://www.reuters.com
[5] Federal Reserve Bank of St. Louis (FRED), Cboe Volatility Index: VIX (VIXCLS). https://fred.stlouisfed.org/series/VIXCLS
Disclosures: Trading involves substantial risk and is not suitable for every investor. Capital is at risk and most day traders lose money. Leverage amplifies both gains and losses, and you can lose more than you deposit. Client accounts are not SIPC or FSCS insured. This content is provided for information and education only. It is not investment advice or a recommendation of any security, and it does not predict the oil price or any stock. Company and sector references describe input-cost and revenue relationships, not recommendations. Oil-price figures are from FRED, chokepoint data from the U.S. Energy Information Administration, and event details are attributed to Reuters, as dated above. See our full disclosures and policies.